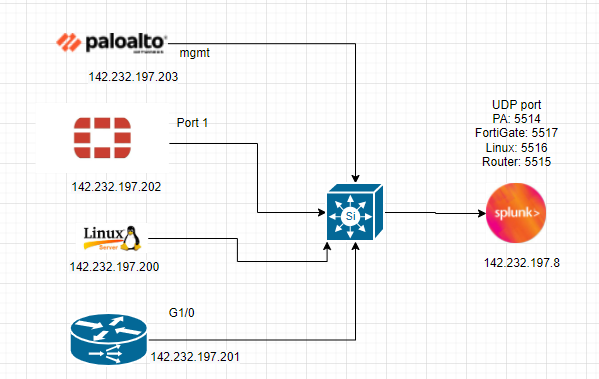
This is a diagram that I have used to deploy this lab.
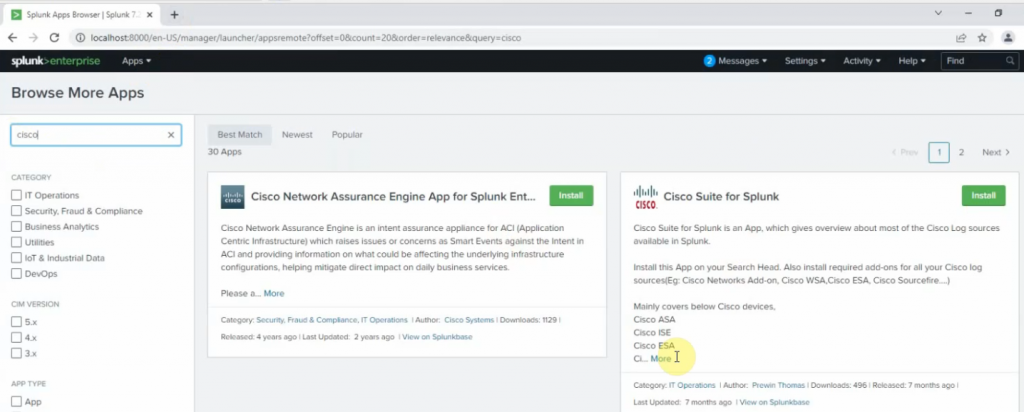
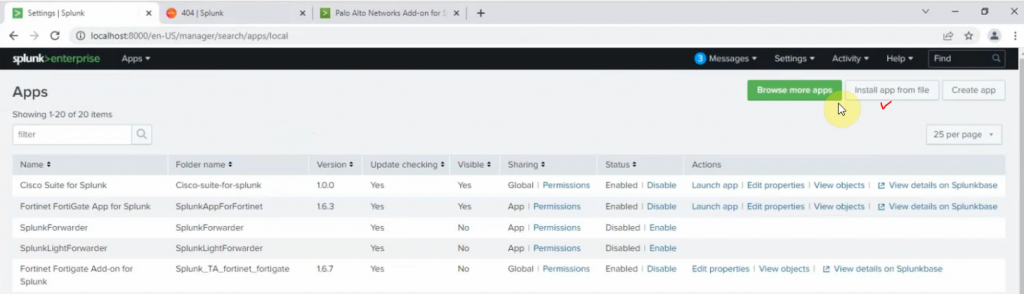
Log in to Splunk, and download Cisco Suite for Splunk, Fortigate, and Palo Alto app for Splunk.
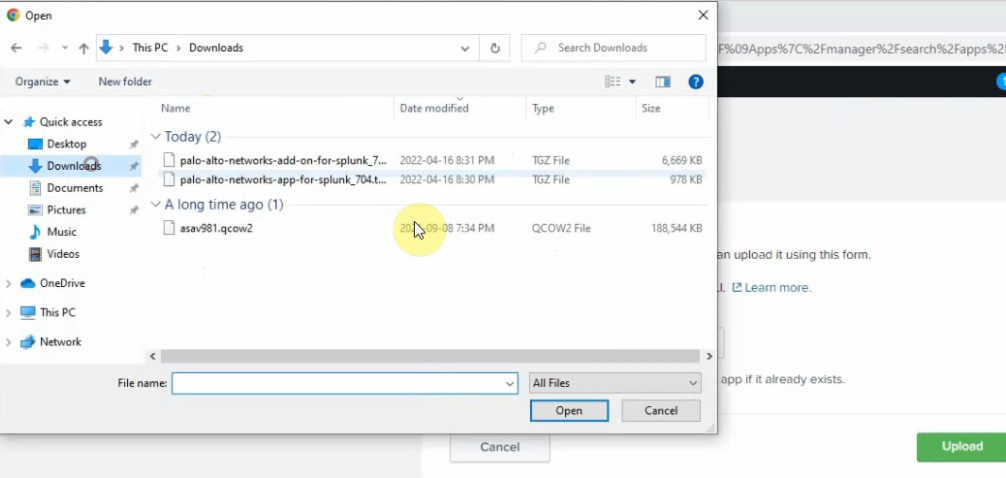
Click Install app from file.
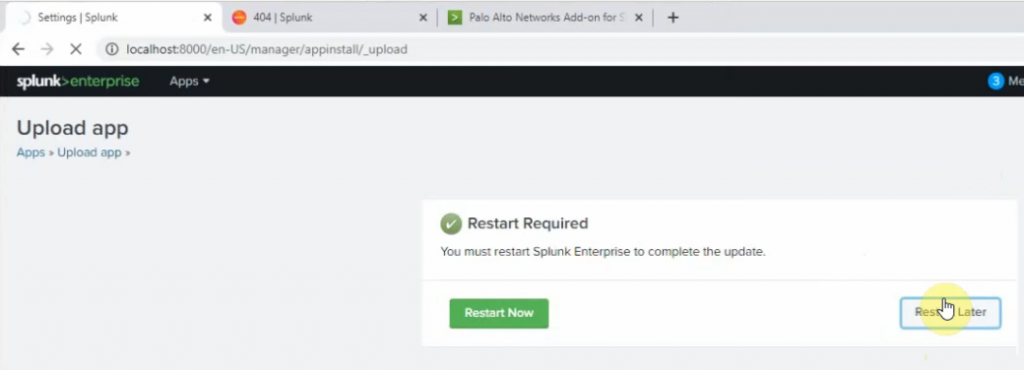
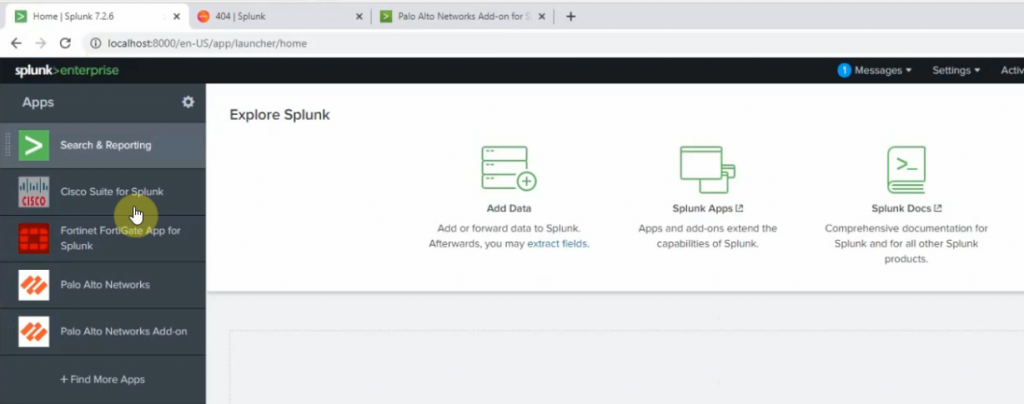
On Splunk.
+ Palo Alto
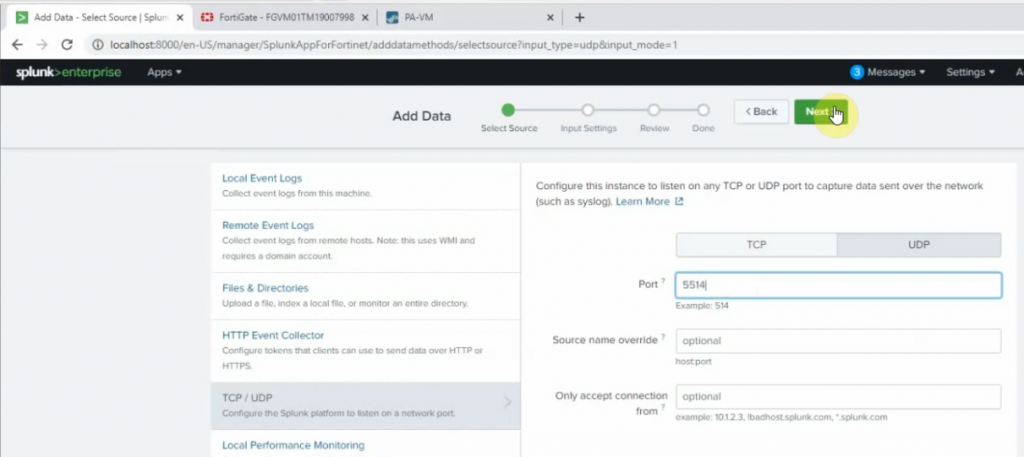
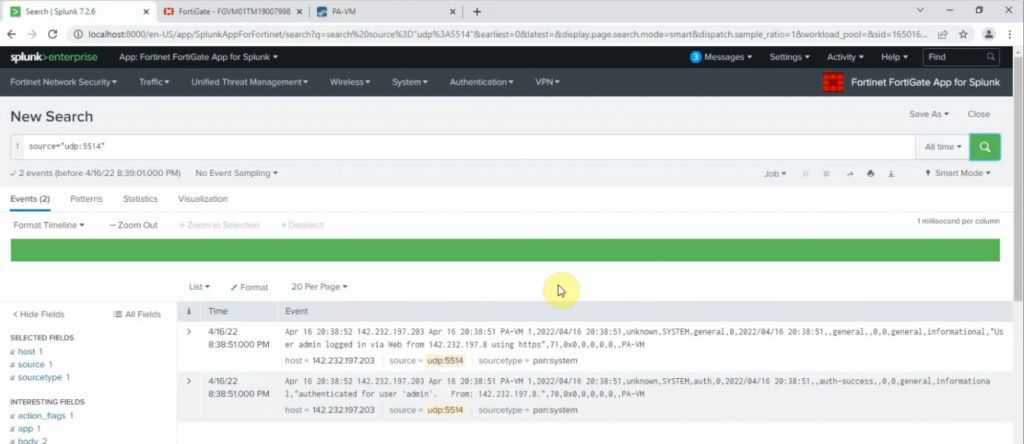
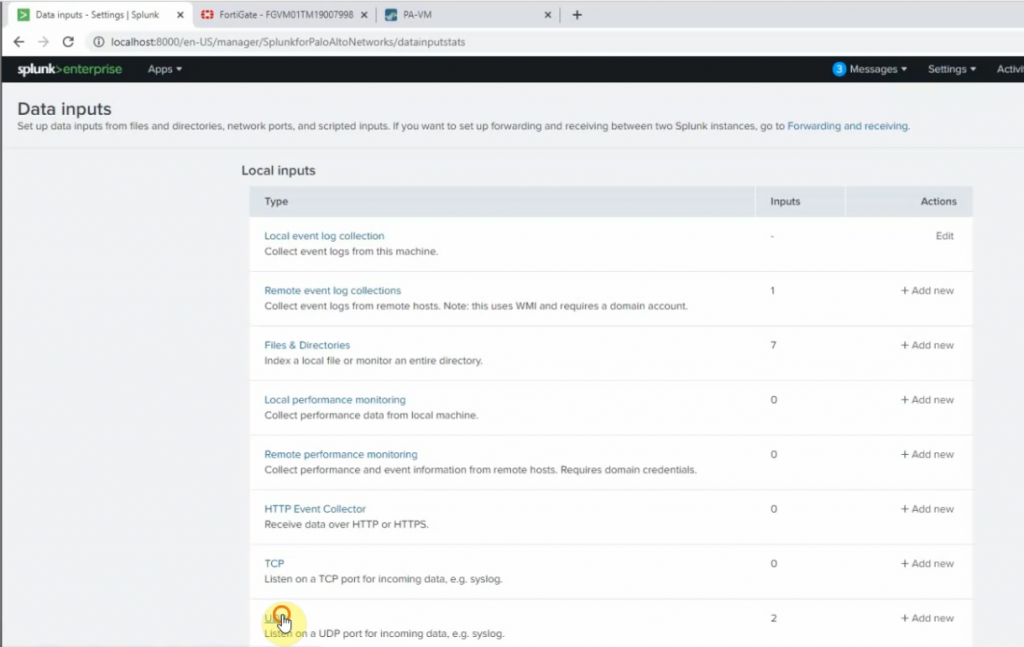
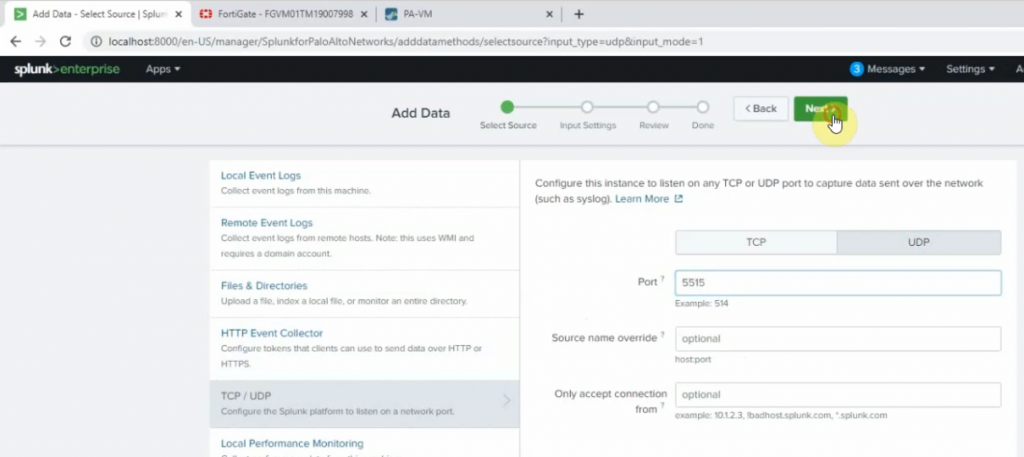
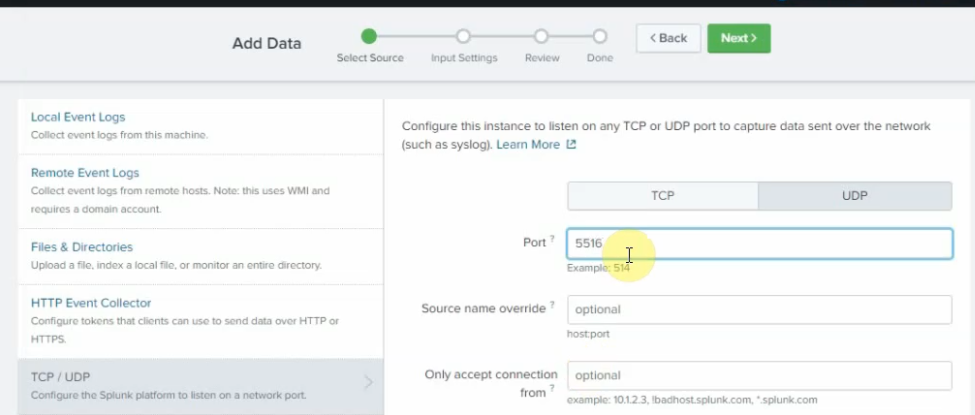
Go to Settings – Data inputs – New Local UDP.
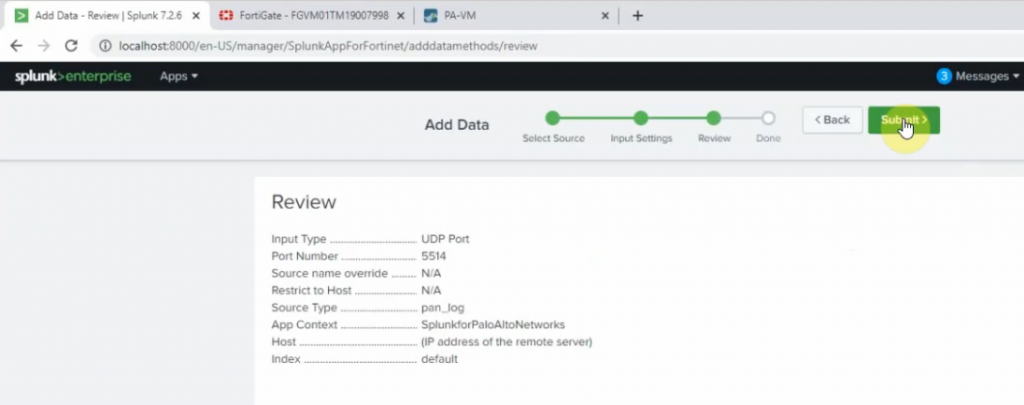
Enter the port 5514 on the Port setting
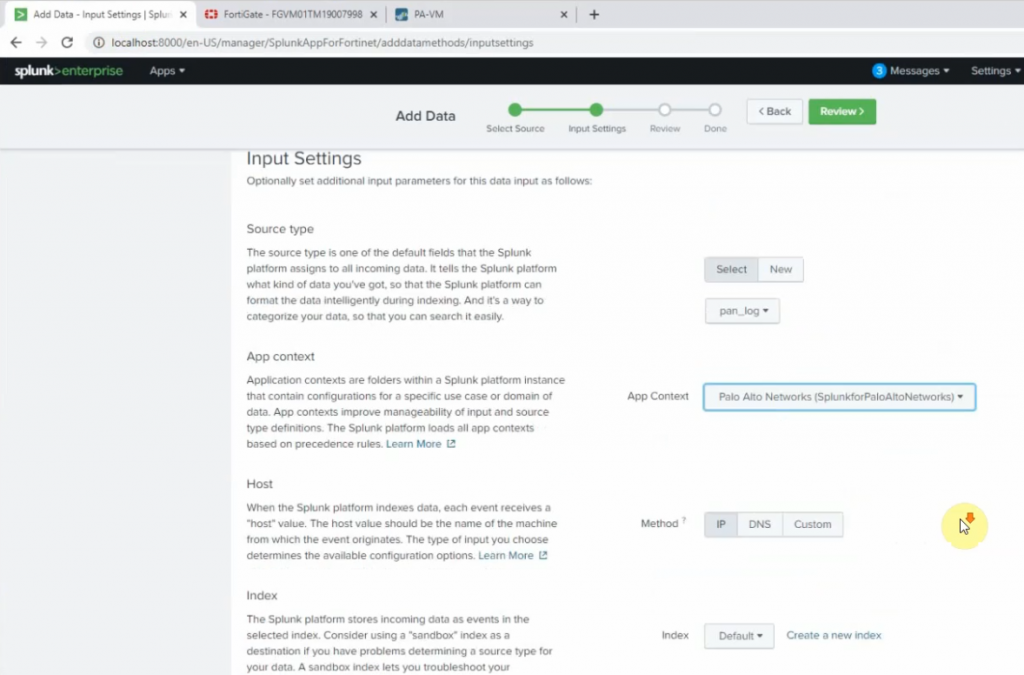
Source type: pan_log
App Control: Palo Alto Networks
Method: IP
Index: Default
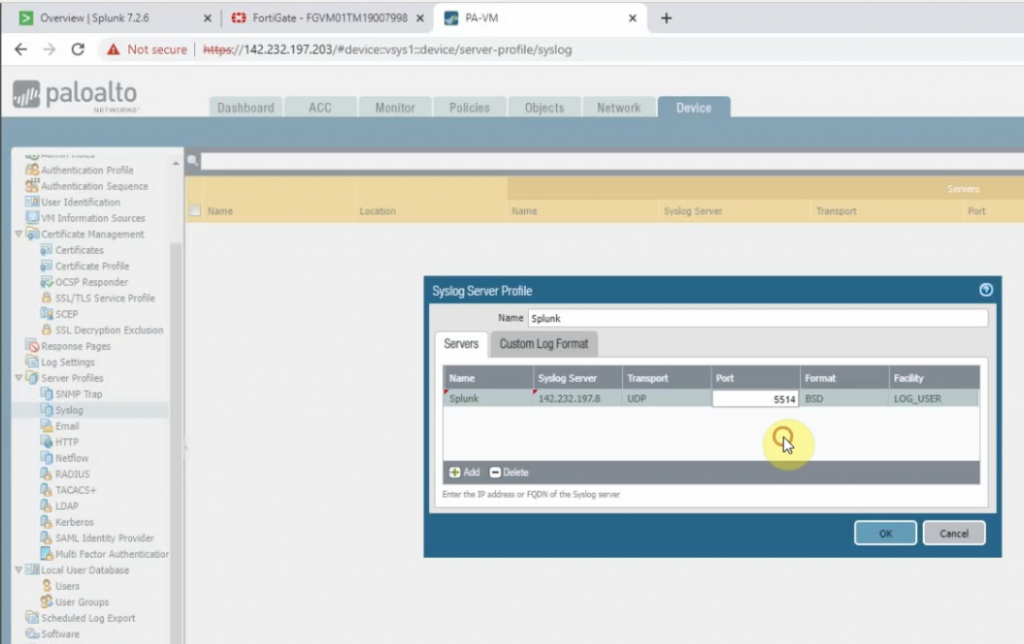
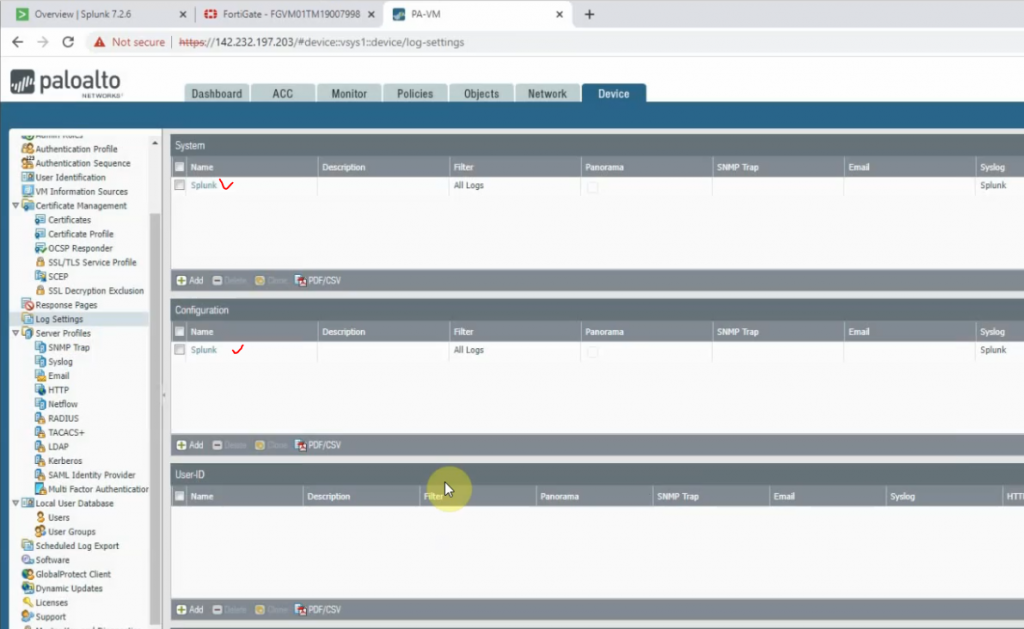
On Palo Alto, configure to send logs to Splunk server with destination port is 5514.
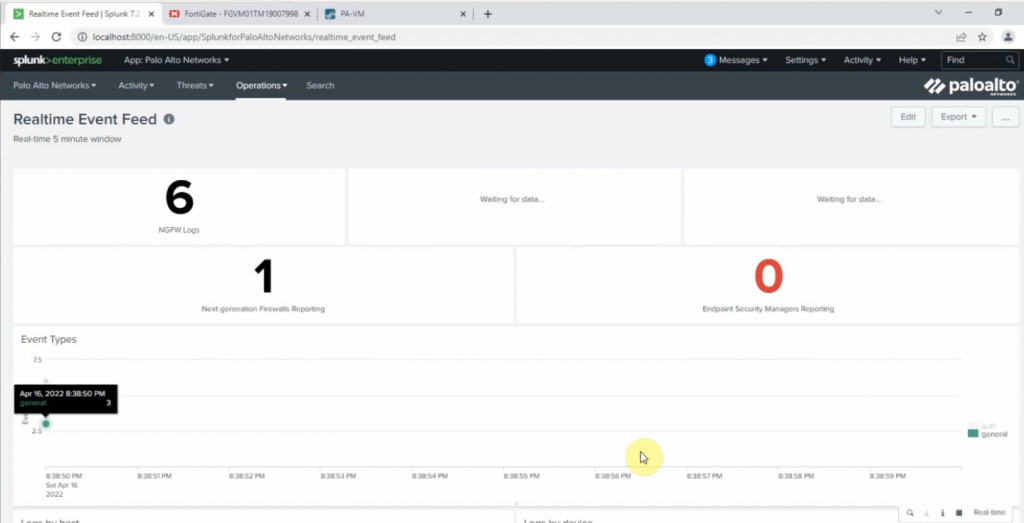
Back to Splunk.
Click Palo Alto App – Operations – Real-time Event Feed.
+ Cisco Router R1.
conf t
logging trap informational
logging host 142.232.197.8 transport udp port 5515
On Splunk.
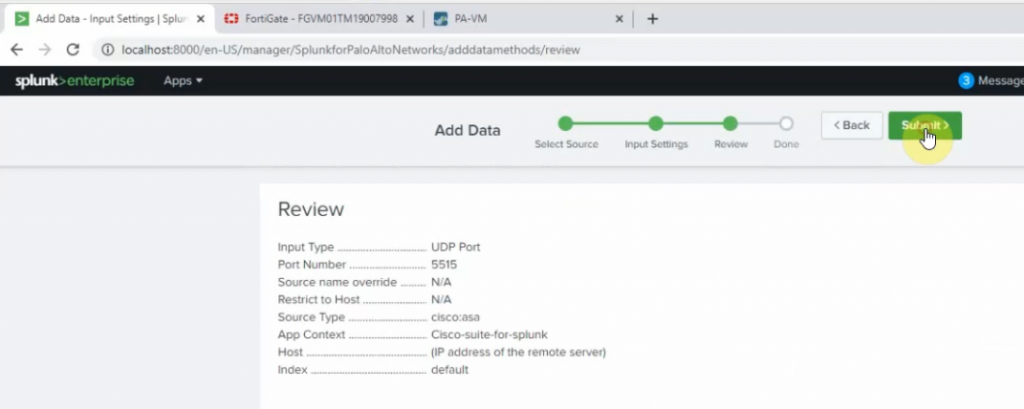
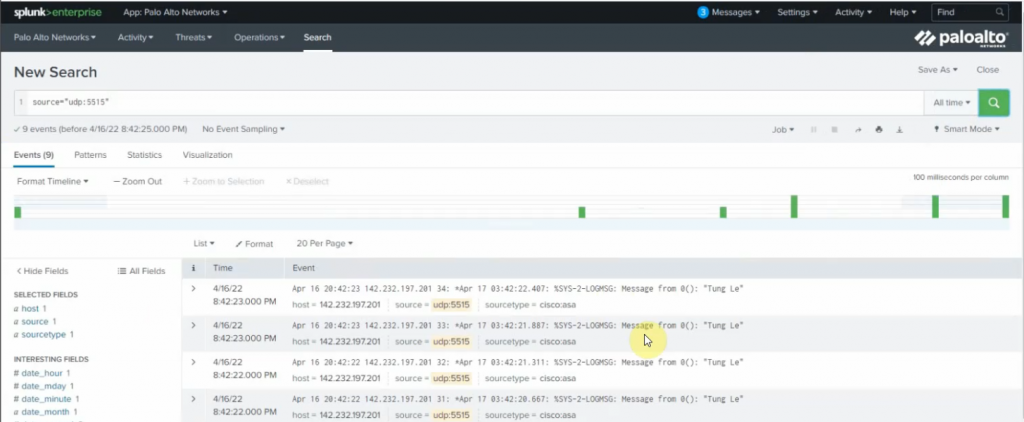
Port 5515
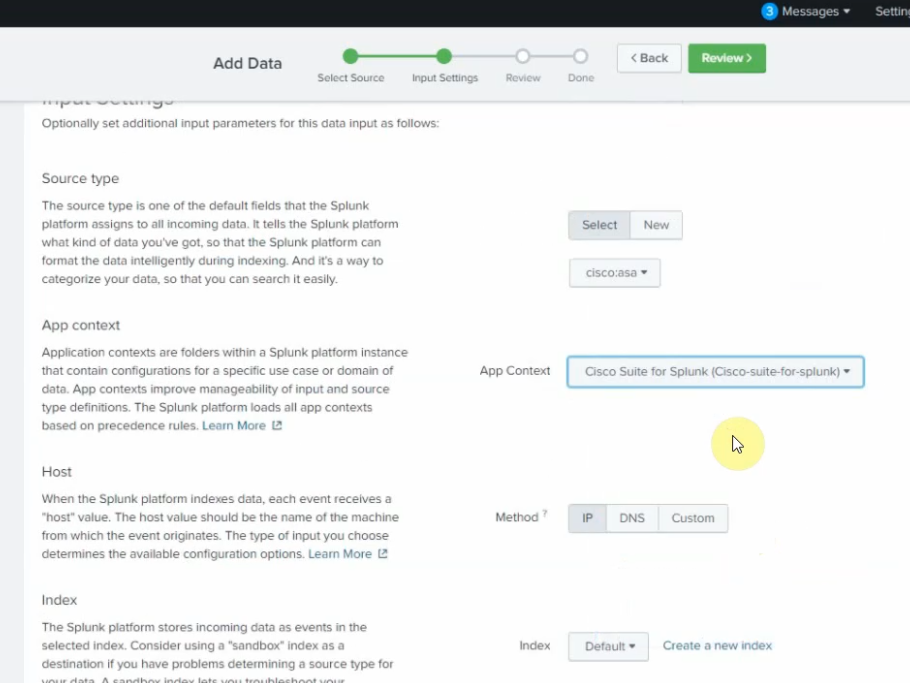
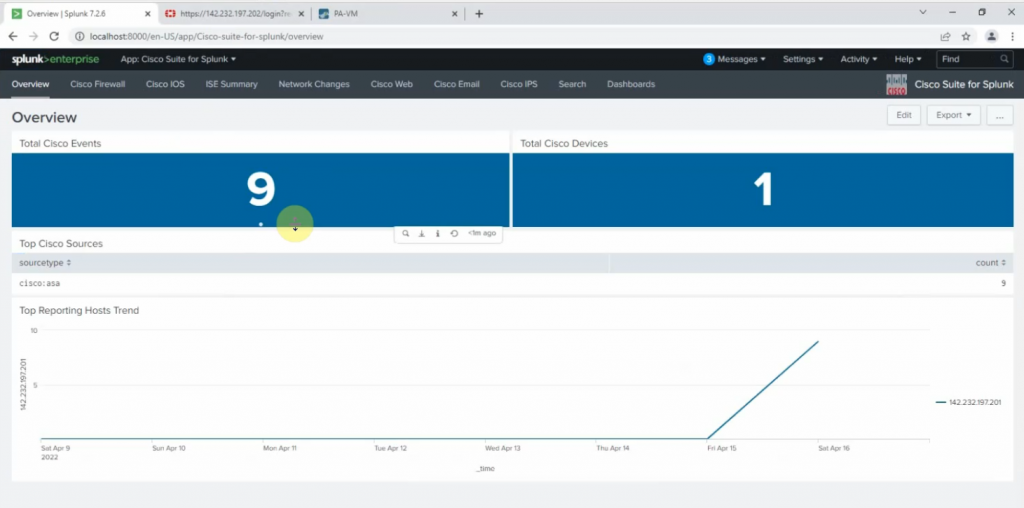
Source type: cisco:asa
App Context: Cisco Suite for Splunk
Method: IP
Index: default.
Back to Router, send sample logs to Splunk.
end
send log "Tung Le"
send log "Tung Le"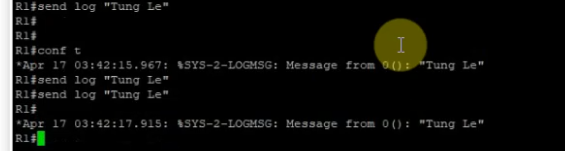
+ On Kali Linux.
sudo su
nano /etc/rsyslog.conf
##Add the following line to the end of the file. The listening port is 5516.
*.*                @142.232.198.8:5516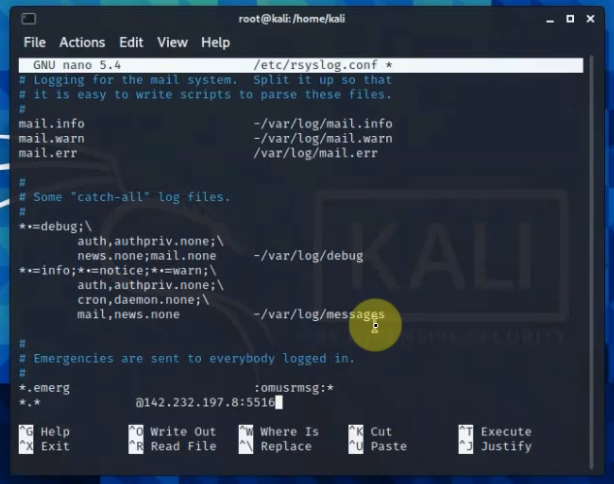
Restart rsyslog service.
systemctl restart rsyslog
systemctl status rsyslog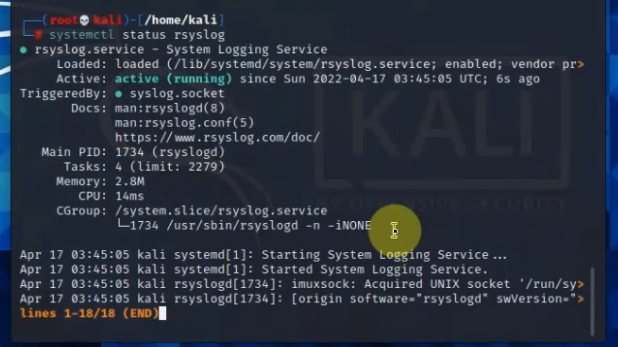
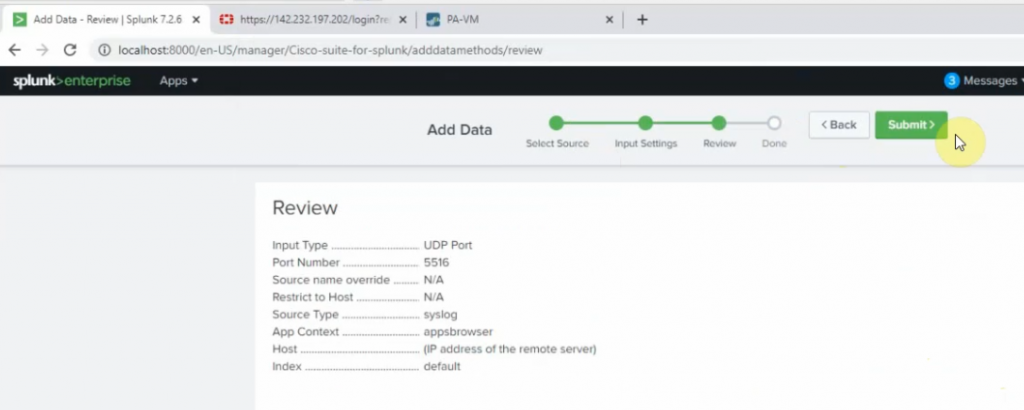
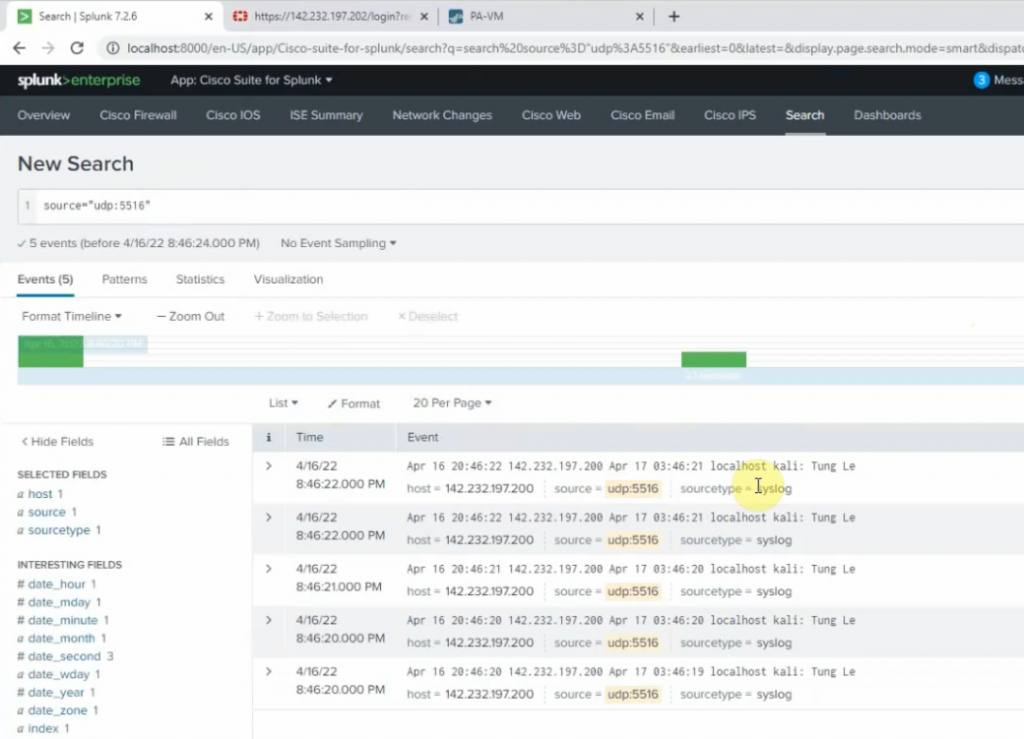
Back to Splunk, configure the listening port for the Linux server is 5516
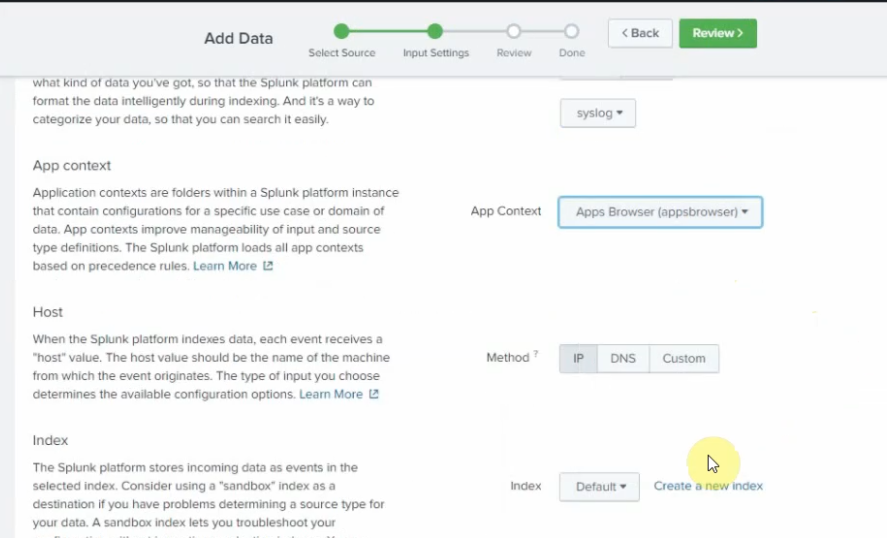
source type: Syslog
app context: Apps Browser
Back to Kali, type the command below to generate logs to Splunk.
logger "Tung Le"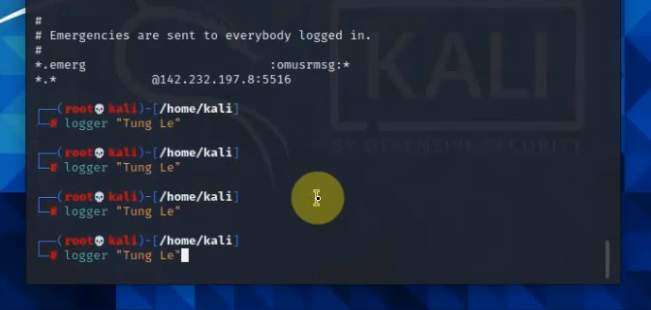
+ FortiGate:
Configure FortiGate to send logs to Splunk via the UDP port 5517.
config log syslogd setting
set status enable
set server 142.232.197.8
set port 5517
end 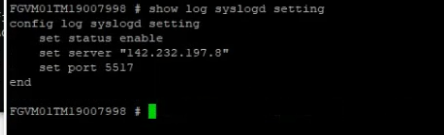
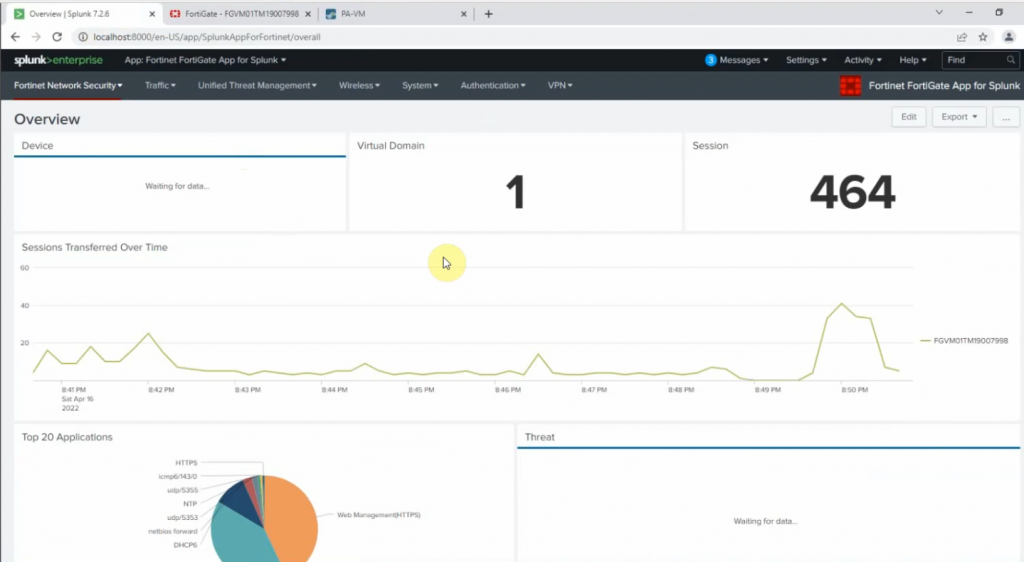
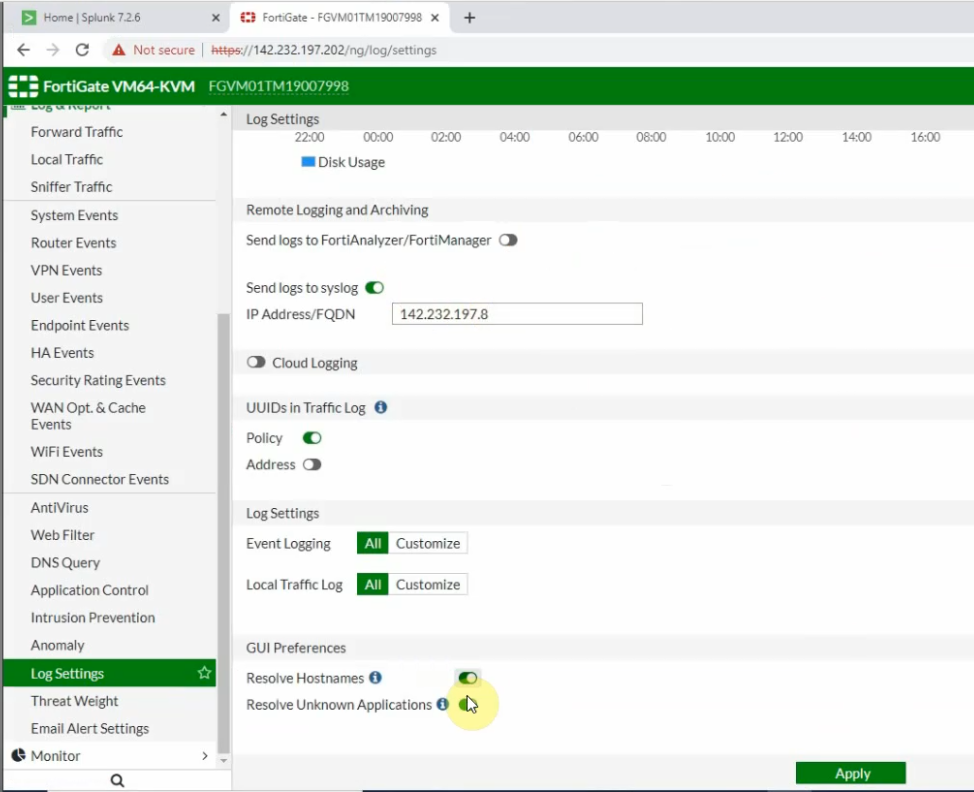
Log into FortiGate, and enable the setting below to send logs to Splunk.
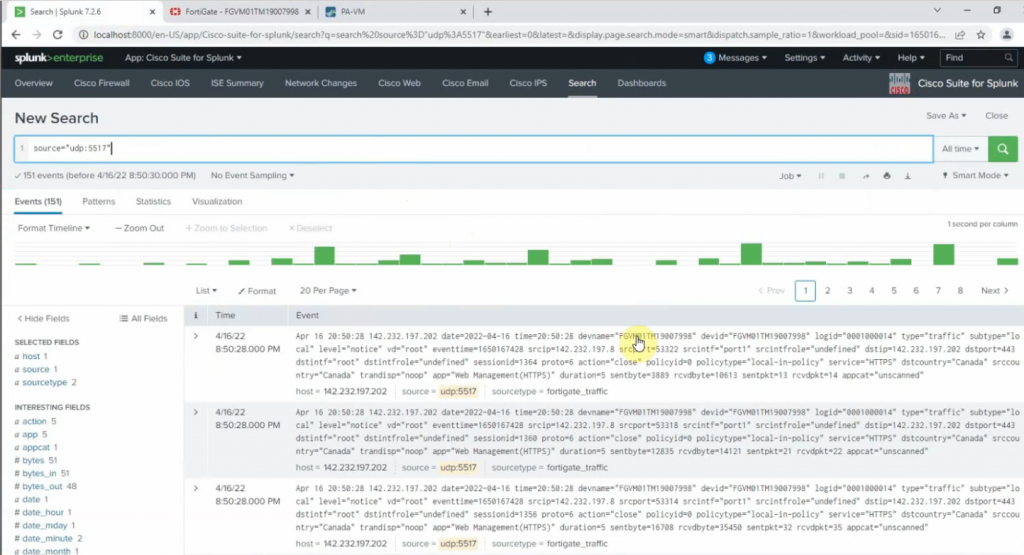
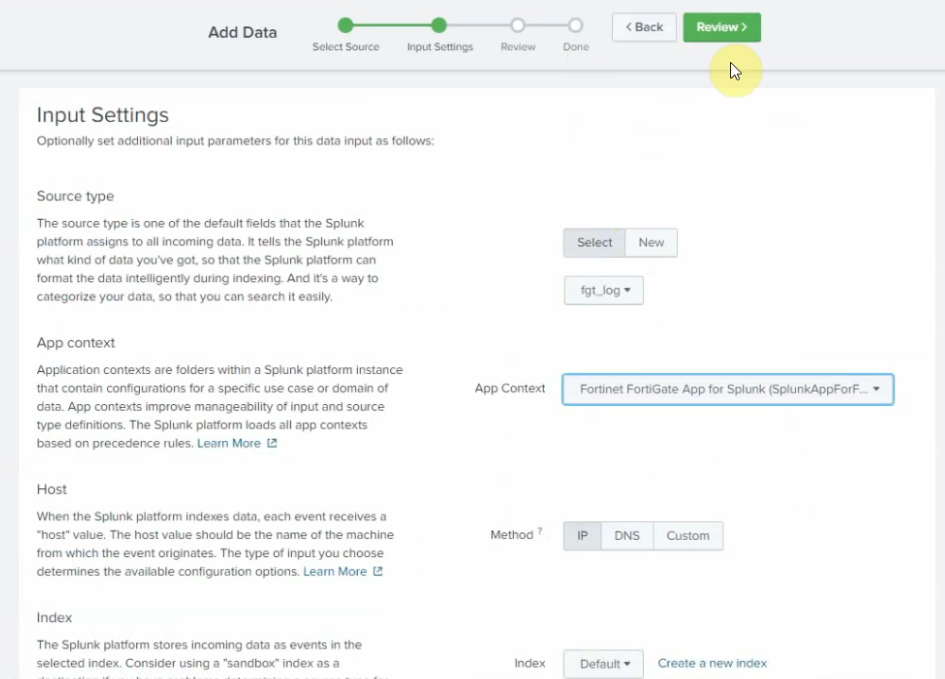
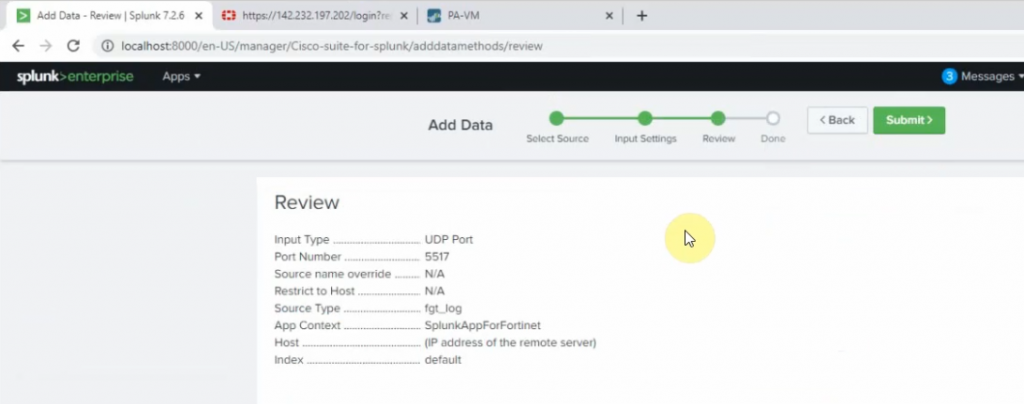
On Splunk, configure port is 5517.
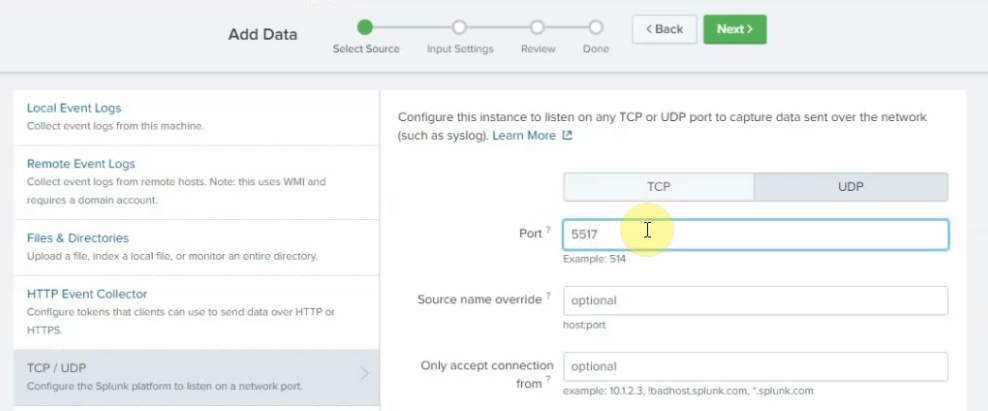
Source type: fgt_log
App Context: FortiGate
Method: IP
Index: Default
Log off FortiGate, type w wrong password to generate logs.